xlwings Reports
This feature requires xlwings PRO.
xlwings Reports is a solution for template-based Excel and PDF reporting. Put differently, xlwings Reports turns Excel into a desktop publishing software. It allows business users without Python knowledge to create and maintain Excel templates without having to rely on a Python developer for every change: xlwings Reports separates the Python code (data acquisition/manipulation) from the Excel template (layout/formatting).
xlwings Reports supports all commonly required components:
- Text: Easily format your text via Markdown syntax.
- Tables: Write pandas DataFrames to Excel cells and Excel tables and format them dynamically based on the number of rows.
- Charts: Use your favorite charting engine: Excel charts, Matplotlib, or Plotly.
- Images: You can include both raster (e.g., png) or vector (e.g., svg) graphics, including dynamically generated ones, e.g., QR codes.
- Multi-column Layout: Split your content up into e.g. a classic two column layout by using Frames.
- Languages: Generate reports in various languages based on a single template.
- PDF Report: Generate PDF reports automatically and “print” the reports on PDFs in your corporate layout for pixel-perfect results including headers, footers, backgrounds and borderless graphics.
Quickstart
You can render one sheet via mysheet.render_template or use the higher-level convenience function xw.create_report which first copies the template workbook and then loops through all sheets:
Render Sheets
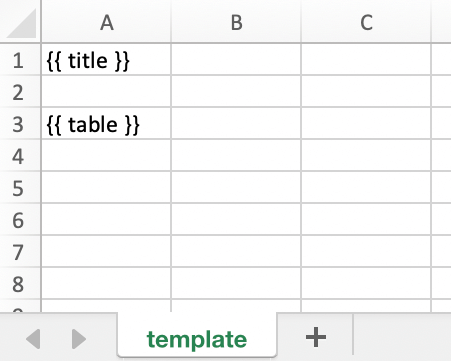
Let’s first look at how to render a single sheet. This is a workbook stored as Book1.xlsx:
Running the following code:
import xlwings as xw
book = xw.Book('Book1.xlsx')
sheet = book.sheets['template'].copy(name='report')
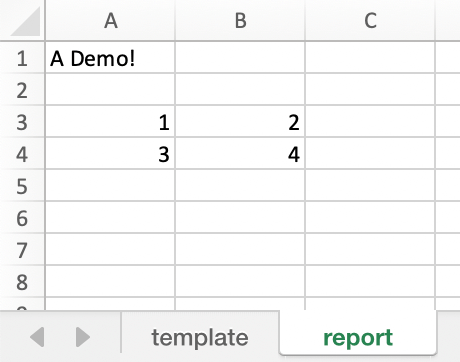
sheet.render_template(title='A Demo!', table=[[1, 2], [3, 4]])
book.to_pdf()
Leaves you with this:
See also the mysheet.render_template (API reference).
New in version 0.22.0.
Render Workbooks
If your template is a full workbook, you can use the create_report function. Start by creating the following Python script mytemplate.py:
from xlwings.pro.reports import create_report
import pandas as pd

df = pd.DataFrame(data=[[1,2],[3,4]])
book = create_report('mytemplate.xlsx', 'myreport.xlsx', title='MyTitle', df=df)
book.to_pdf()
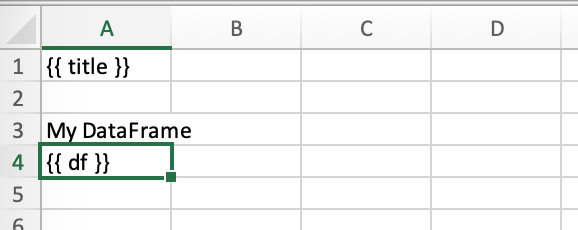
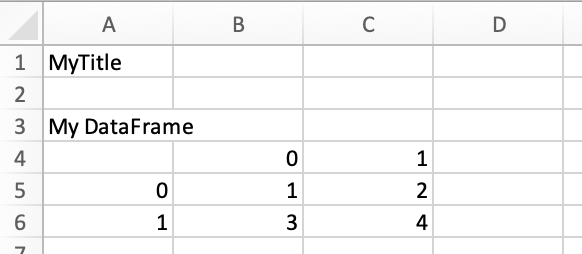
Then create the following Excel file called mytemplate.xlsx:
Now run the Python script:
python mytemplate.py
This will copy the template and create the following output by replacing the variables in double curly braces with the value from the Python variable:
See also create_reports (API reference).
Note
By default, xlwings Reports overwrites existing values in templates if there is not enough free space for your variable. If you want your rows to dynamically shift according to the height of your array, use Frames.
DataFrames
When you work with pandas DataFrames, you’ll often need to tweak the data. Thanks to filters, you can do the most common operations directly in your template. A filter is added to the placeholder in Excel, separated by the pipe character. You can combine multiple filters by using multiple pipe characters. Let’s start with a couple of examples before looking at each filter in more detail:
import xlwings as xw
import pandas as pd

book = xw.Book('Book1.xlsx')
sheet = book.sheets['template'].copy(name='report')
df = pd.DataFrame({'one': [1, 2, 3], 'two': [4, 5, 6], 'three': [7, 8, 9]})
sheet.render_template(df=df)
Available filters for DataFrames:
noindex: Hide the index
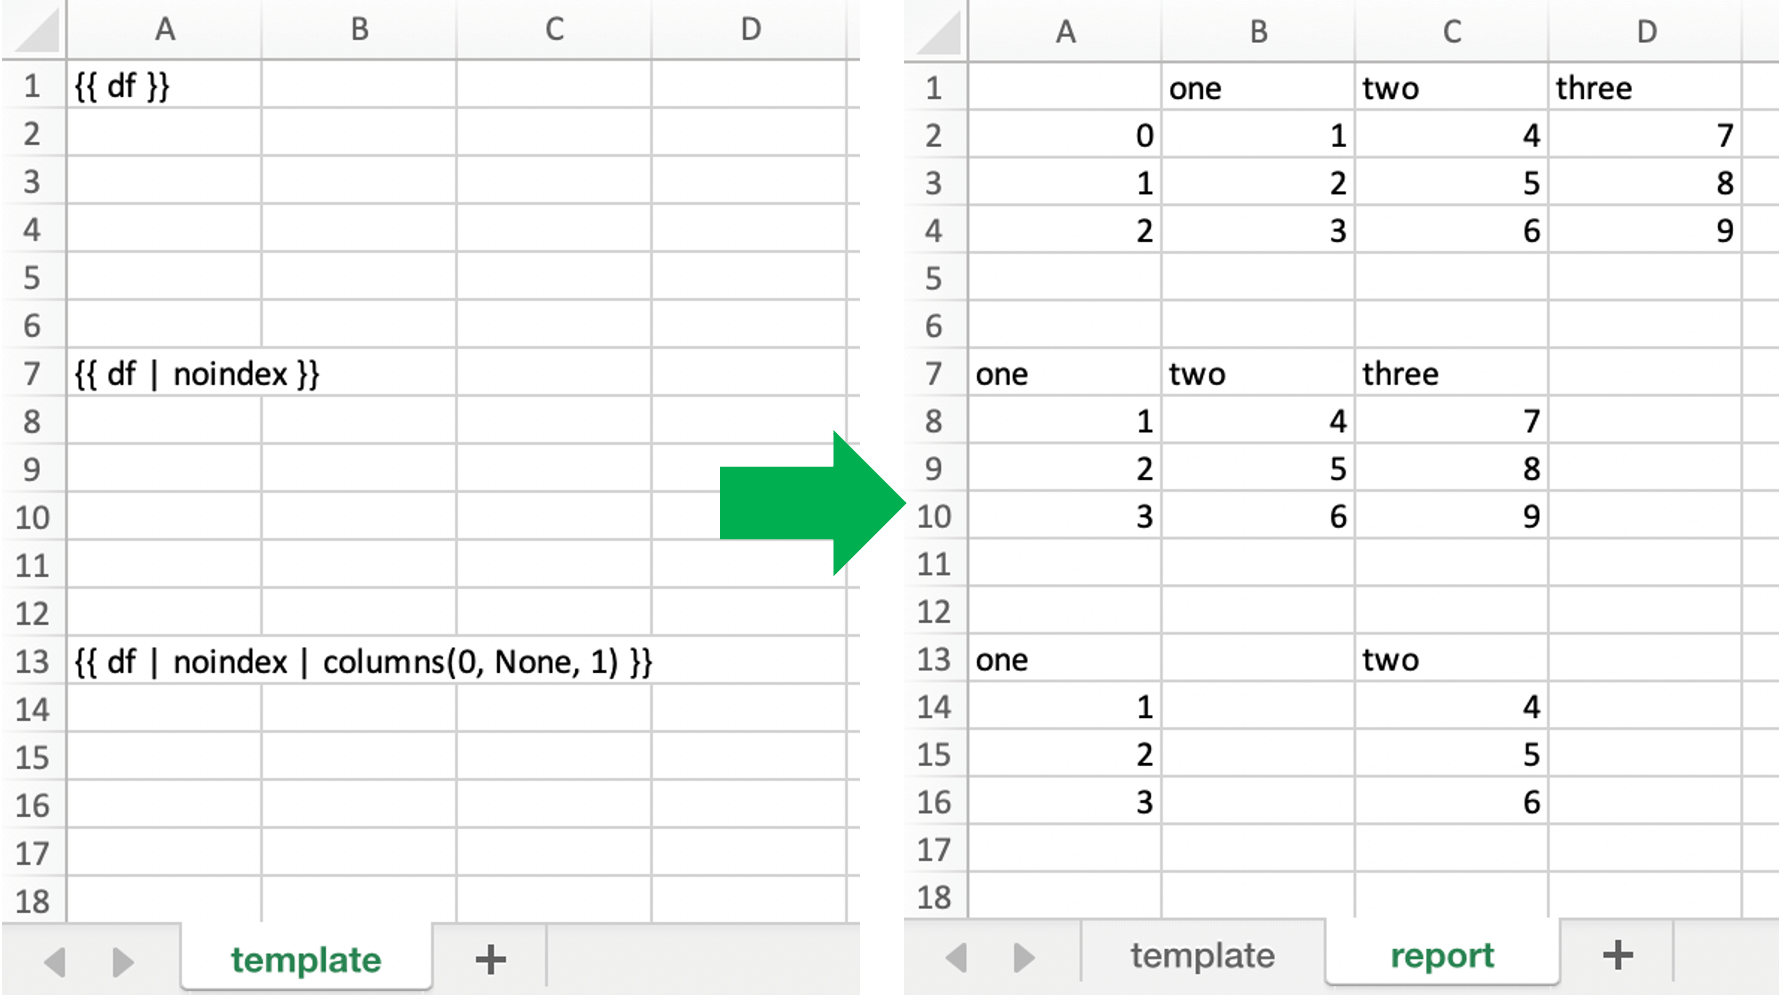
Example:
{{ df | noindex }}
noheader: Hide the column headers
Example:
{{ df | noheader }}
body: Only write the body of the DataFrame
Example (this is equivalent to
{{ df | noindex | noheader }}):{{ df | body }}
sortasc: Sort in ascending order (indices are zero-based)
Example: sort by second, then by first column:
{{ df | sortasc(1, 0) }}
sortdesc: Sort in descending order (indices are zero-based)
Example: sort by first, then by second column in descending order:
{{ df | sortdesc(0, 1) }}
columns: Select/reorder columns and insert empty columns (indices are zero-based)
See also:
colsliceExample: introduce an empty column (
None) as the second column and switch the order of the second and third column:{{ df | columns(0, None, 2, 1) }}
Note
Merged cells: you’ll also have to introduce empty columns if you are using merged cells in your Excel template.
maxrows: Maximum number of rows (currently, only
sumis supported as aggregation function)If your DataFrame has 12 rows and you use
maxrows(10, Other)as filter, you’ll get a table that shows the first 9 rows as-is and sums up the remaining 3 rows under the labelOther. If your data is unsorted, combine it with thesortasc/sortdescto make sure the correct rows are aggregated.See also:
aggsmall,head,tail,rowsliceSyntax:
{{ df | maxrows(number_rows, label, label_col_ix) }}
label_col_ixis optional: if left away, it will label the index of the DataFrame (index is zero-based)Examples:
{{ df | maxrows(10, Other) }}
{{ df | maxrows(10, Other, 0) }}
{{ df | sortasc(1)| noindex | maxrows(5, Other) }}
aggsmall: Aggregate rows with values below a certain threshold (currently, only
sumis supported as aggregation function)If the values in the specified row are below the threshold values, they will be summed up in a single row.
See also:
maxrows,head,tail,rowsliceSyntax:
{{ df | aggsmall(threshold, threshold_col_ix, label, label_col_ix) }}
label_col_ixis optional: if left away, it will label the index of the DataFrame (indices are zero-based)Examples:
{{ df | aggsmall(0.1, 2, Other) }}
{{ df | aggsmall(0.5, 1, Other, 0) }}
{{ df | sortasc(1)| noindex | aggsmall(0.1, 2, Other) }}
head: Only show the top n rows
See also:
maxrows,aggsmall,tail,rowsliceExample:
{{ df | head(3) }}
tail: Only show the bottom n rows
See also:
maxrows,aggsmall,head,rowsliceExample:
{{ df | tail(5) }}
rowslice: Slice the rows
See also:
maxrows,aggsmall,head,tailSyntax:
{{ df | rowslice(start_index, stop_index) }}
stop_indexis optional: if left away, it will stop at the end of the DataFrameExample: Show rows 2 to 4 (indices are zero-based and interval is half-open, i.e. the start is including and the end is excluding):
{{ df | rowslice(2, 5) }}
Example: Show rows 2 to the end of the DataFrame:
{{ df | rowslice(2) }}
colslice: Slice the columns
See also:
columnsSyntax:
{{ df | colslice(start_index, stop_index) }}
stop_indexis optional: if left away, it will stop at the end of the DataFrameExample: Show columns 2 to 4 (indices are zero-based and interval is half-open, i.e. the start is including and the end is excluding):
{{ df | colslice(2, 5) }}
Example: Show columns 2 to the end of the DataFrame:
{{ df | colslice(2) }}
Excel Tables
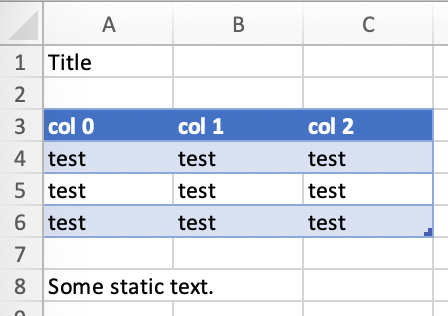
Using Excel tables is the recommended way to format tables as the styling can be applied dynamically across columns and rows. You can also use themes and apply alternating colors to rows/columns. Go to Insert > Table and make sure that you activate My table has headers before clicking on OK. Add the placeholder as usual on the top-left of your Excel table:
Running the following script:
from xlwings.pro.reports import create_report
import pandas as pd

nrows, ncols = 3, 3
df = pd.DataFrame(data=nrows * [ncols * ['test']],
                  columns=[f'col {i}' for i in range(ncols)])

create_report('template.xlsx', 'output.xlsx', df=df)
Will produce the following report:
Note
- At the moment, you can only assign pandas DataFrames to tables
- For Excel table support, you need at least version 0.21.0
Excel Charts
Note: To use charts with an Excel table as source, you’ll need at least xlwings version 0.22.1
To use Excel charts in your reports, follow this process:
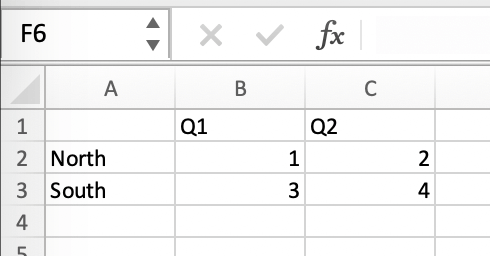
Add some sample/dummy data to your Excel template:
If your data source is dynamic, turn it into an Excel Table (
Insert>Table). Make sure you do this before adding the chart in the next step.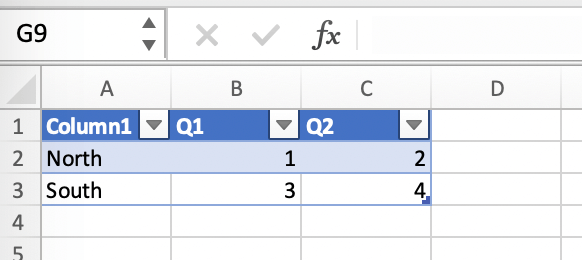
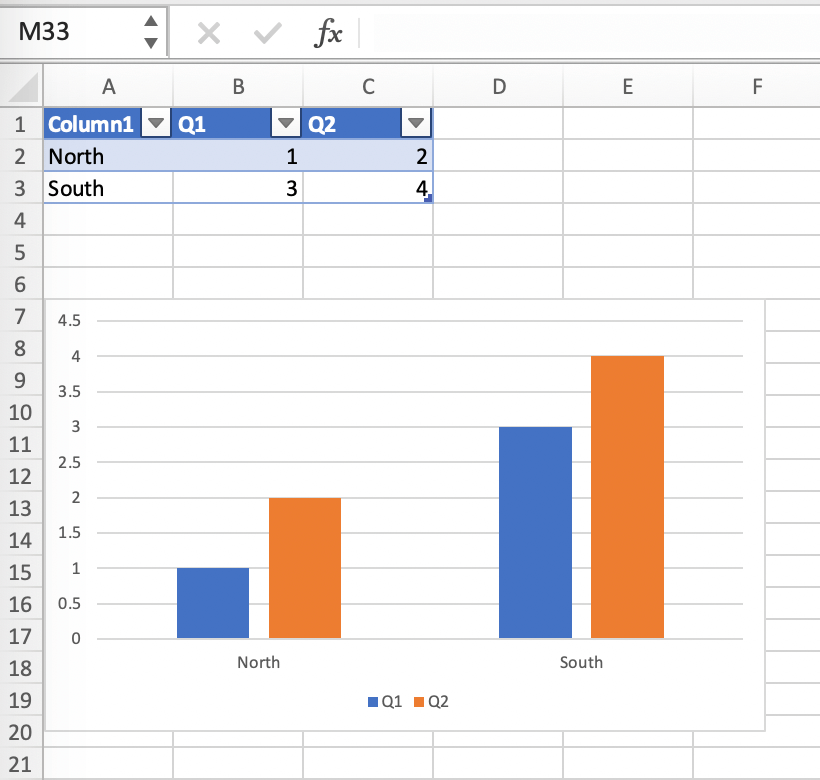
Add your chart and style it:
Reduce the Excel table to a 2 x 2 range and add the placeholder in the top-left corner (in our example
chart_data) . You can leave in some dummy data or clear the values of the Excel table: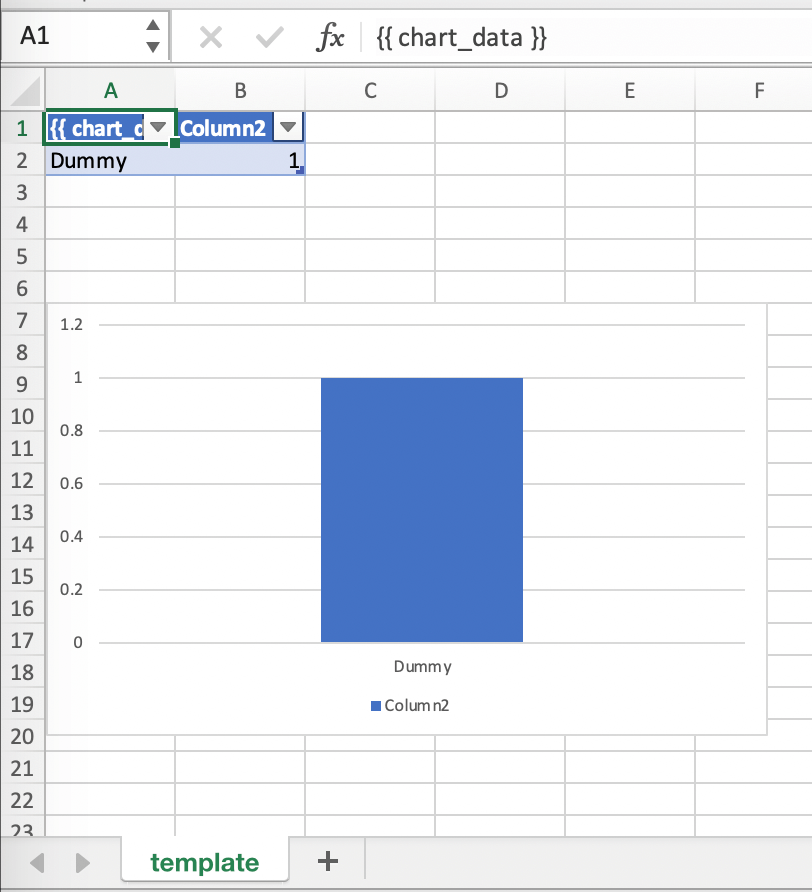
Assuming your file is called
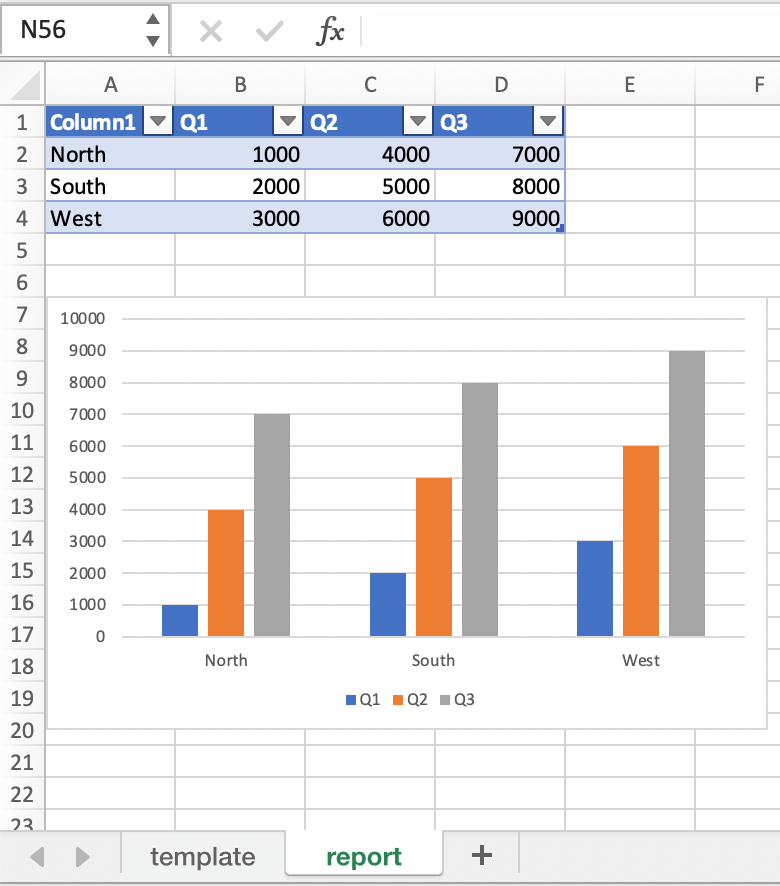
mytemplate.xlsxand your sheettemplatelike on the previous screenshot, you can run the following code:import xlwings as xw import pandas as pd df = pd.DataFrame(data={'Q1': [1000, 2000, 3000], 'Q2': [4000, 5000, 6000], 'Q3': [7000, 8000, 9000]}, index=['North', 'South', 'West']) book = xw.Book("mytemplate.xlsx") sheet = book.sheets['template'].copy(name='report') sheet.render_template(chart_data=df)
This will produce the following report, with the chart source correctly adjusted:
Note: If you don’t want the source data on your report, you might want to place it on a separate sheet. It’s easiest if you add and design the chart on the separate sheet, before cutting the chart and pasting it on your report template.
Images
Images are inserted so that the cell with the placeholder will become the top-left corner of the image. For example, write the following placeholder into you desired cell: {{ logo }}, then run the following code:
import xlwings as xw
from xlwings.pro.reports import Image

book = xw.Book('Book1.xlsx')
sheet = book.sheets['template'].copy(name='report')
sheet.render_template(logo=Image(r'C:\path\to\logo.png'))
Note: Image also accepts a pathlib.Path object instead of a string.
If you want to use vector-based graphics, you can use svg on Windows and eps on macOS. You can control the appearance of your image by applying filters on your placeholder.
Available filters for Images:
width: Set the width in pixels (height will be scaled proportionally).
Example:
{{ logo | width(200) }}
height: Set the height in pixels (width will be scaled proportionally).
Example:
{{ logo | height(200) }}
width and height: Setting both width and height will distort the proportions of the image!
Example:
{{ logo | height(200) | width(200) }}
scale: Scale your image using a factor (height and width will be scaled proportionally).
Example:
{{ logo | scale(1.2) }}
Matplotlib and Plotly Plots
For a general introduction on how to handle Matplotlib and Plotly, see also: Matplotlib & Plotly Charts. There, you’ll also find the prerequisites to be able to export Plotly charts as pictures.
Matplotlib
Write the following placeholder in the cell where you want to paste the Matplotlib plot: {{ lineplot }}. Then run the following code to get your Matplotlib Figure object:
import matplotlib.pyplot as plt
import xlwings as xw

fig = plt.figure()
plt.plot([1, 2, 3])

book = xw.Book('Book1.xlsx')
sheet = book.sheets['template'].copy(name='report')
sheet.render_template(lineplot=fig)
Plotly
Plotly works practically the same:
import plotly.express as px
import xlwings as xw

fig = px.line(x=["a","b","c"], y=[1,3,2], title="A line plot")
book = xw.Book('Book1.xlsx')
sheet = book.sheets['template'].copy(name='report')
sheet.render_template(lineplot=fig)
To change the appearance of the Matplotlib or Plotly plot, you can use the same filters as with images, namely:
- width
- height
- size
Additionally, you can use the following filter:
format: allows to change the default image format from
pngto e.g.,svgon Windows orepson macOS, which will export the plot as vector graphics. As an example, to make the chart smaller and use thesvgformat, you would write the following placeholder:{{ lineplot | scale(0.8) | format(svg) }}
Text
You can work with placeholders in text that lives in cells or shapes like text boxes. If you have more than just a few words, text boxes usually make more sense as they won’t impact the row height no matter how you style them. This is key to getting a consistent multi-page report.
Simple Text without Formatting
New in version 0.21.4.
You can use any shapes like rectangles or circles, not just text boxes:
from xlwings.pro.reports import create_report
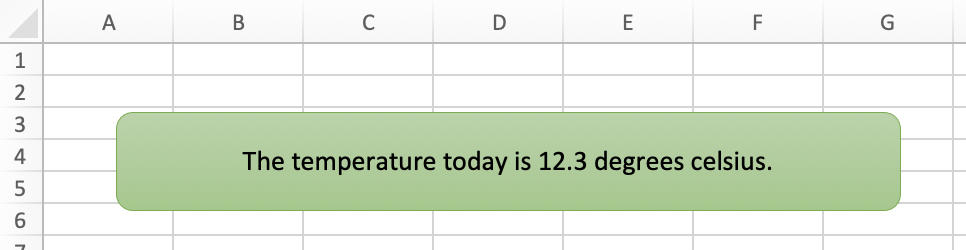
create_report('template.xlsx', 'output.xlsx', temperature=12.3)
This code turns this template:
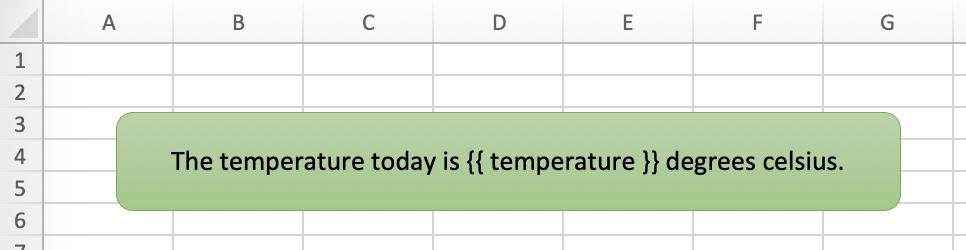
into this report:
While this works for simple text, you will lose the formatting if you have any. To prevent that, use a Markdown object:
Markdown Formatting
New in version 0.23.0.
You can format text in cells or shapes via Markdown syntax. Note that you can also use placeholders in the Markdown text that will take the values from the variables you supply via the render_template or create_report functions:
import xlwings as xw
from xlwings.pro import Markdown

mytext = """\
# Title

Text **bold** and *italic*

* A first bullet
* A second bullet

# {{ second_title }}

This paragraph has a line break.
Another line.
"""

# The first sheet requires a shape as shown on the screenshot
sheet = xw.sheets.active
sheet.render_template(myplaceholder=Markdown(mytext),
                      second_title='Another Title')
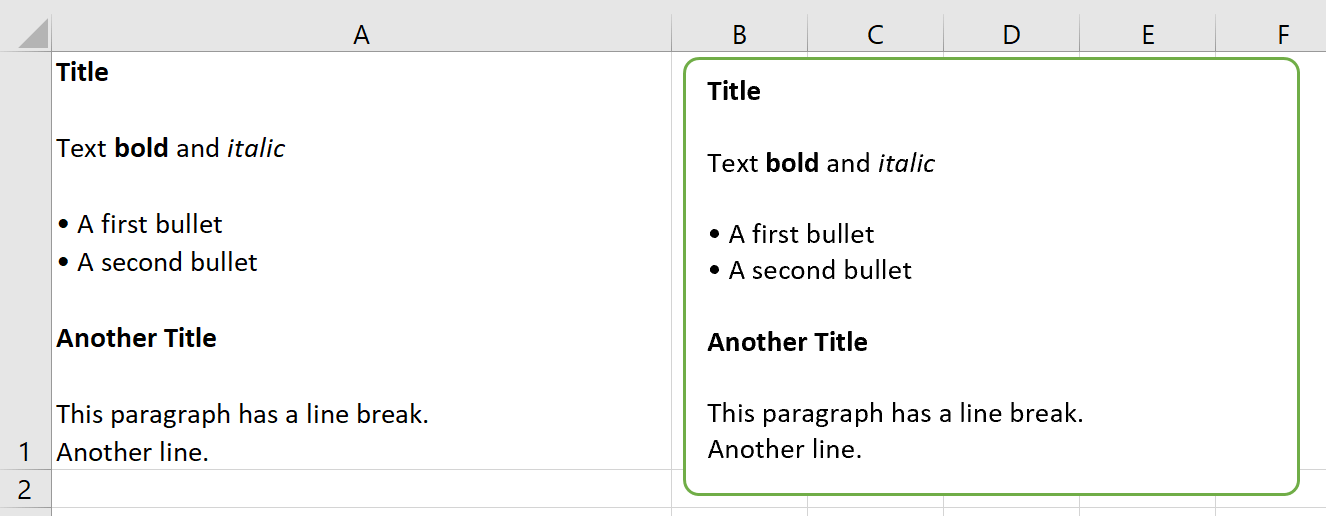
This will render this template with the placeholder in a cell and a shape:
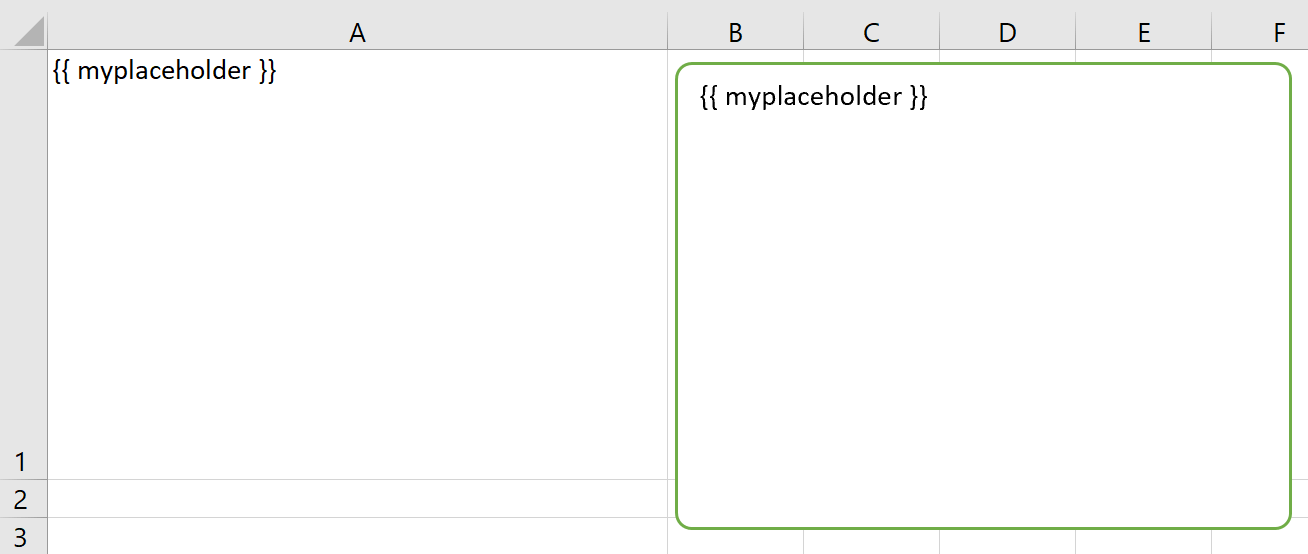
Like this (this uses the default formatting):
For more details about Markdown, especially about how to change the styling, see Markdown Formatting.
Frames: Multi-column Layout
Frames are vertical containers in which content is being aligned according to their height. That is, within Frames:
- Variables do not overwrite existing cell values as they do without Frames.
- Formatting is applied dynamically, depending on the number of rows your object uses in Excel
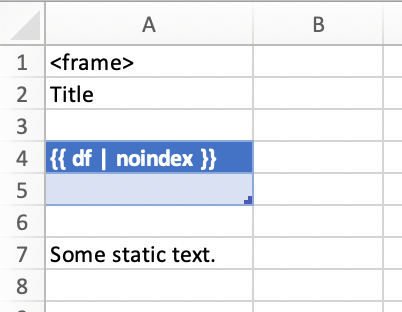
To use Frames, insert a Note with the text <frame> into row 1 of your Excel template wherever you want a new dynamic column
to start. Frames go from one <frame> to the next <frame> or the right border of the used range.
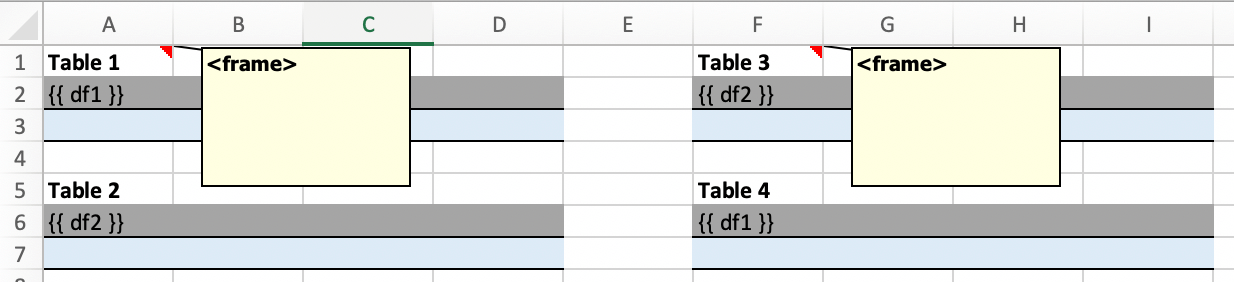
How Frames behave is best demonstrated with an example: The following screenshot defines two frames. The first one goes from column A to column E and the second one goes from column F to column I, since this is the last column that is used.
You can define and format DataFrames by formatting
- one header and
- one data row
If you use the noheader filter for DataFrames, you can leave the header away and format a single data row.
Alternatively, you could also use Excel Tables, as they can make formatting easier.
Running the following code:
from xlwings.pro.reports import create_report
import pandas as pd

df1 = pd.DataFrame([[1, 2, 3], [4, 5, 6], [7, 8, 9]])
df2 = pd.DataFrame([[1, 2, 3], [4, 5, 6], [7, 8, 9], [10, 11, 12], [13, 14, 15]])

data = dict(df1=df1, df2=df2)

create_report('my_template.xlsx',
              'my_report.xlsx',
              **data)
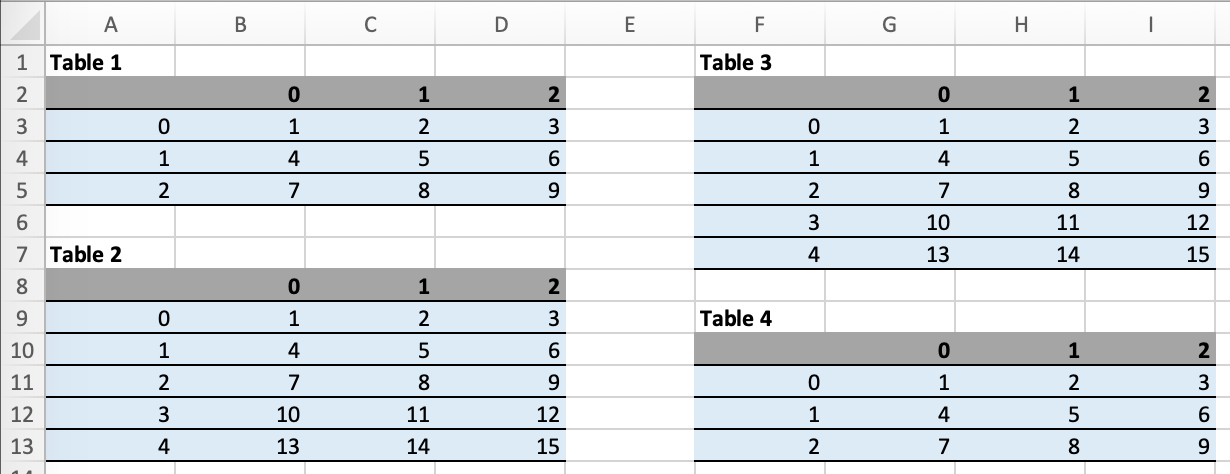
will generate this report:
PDF Layout
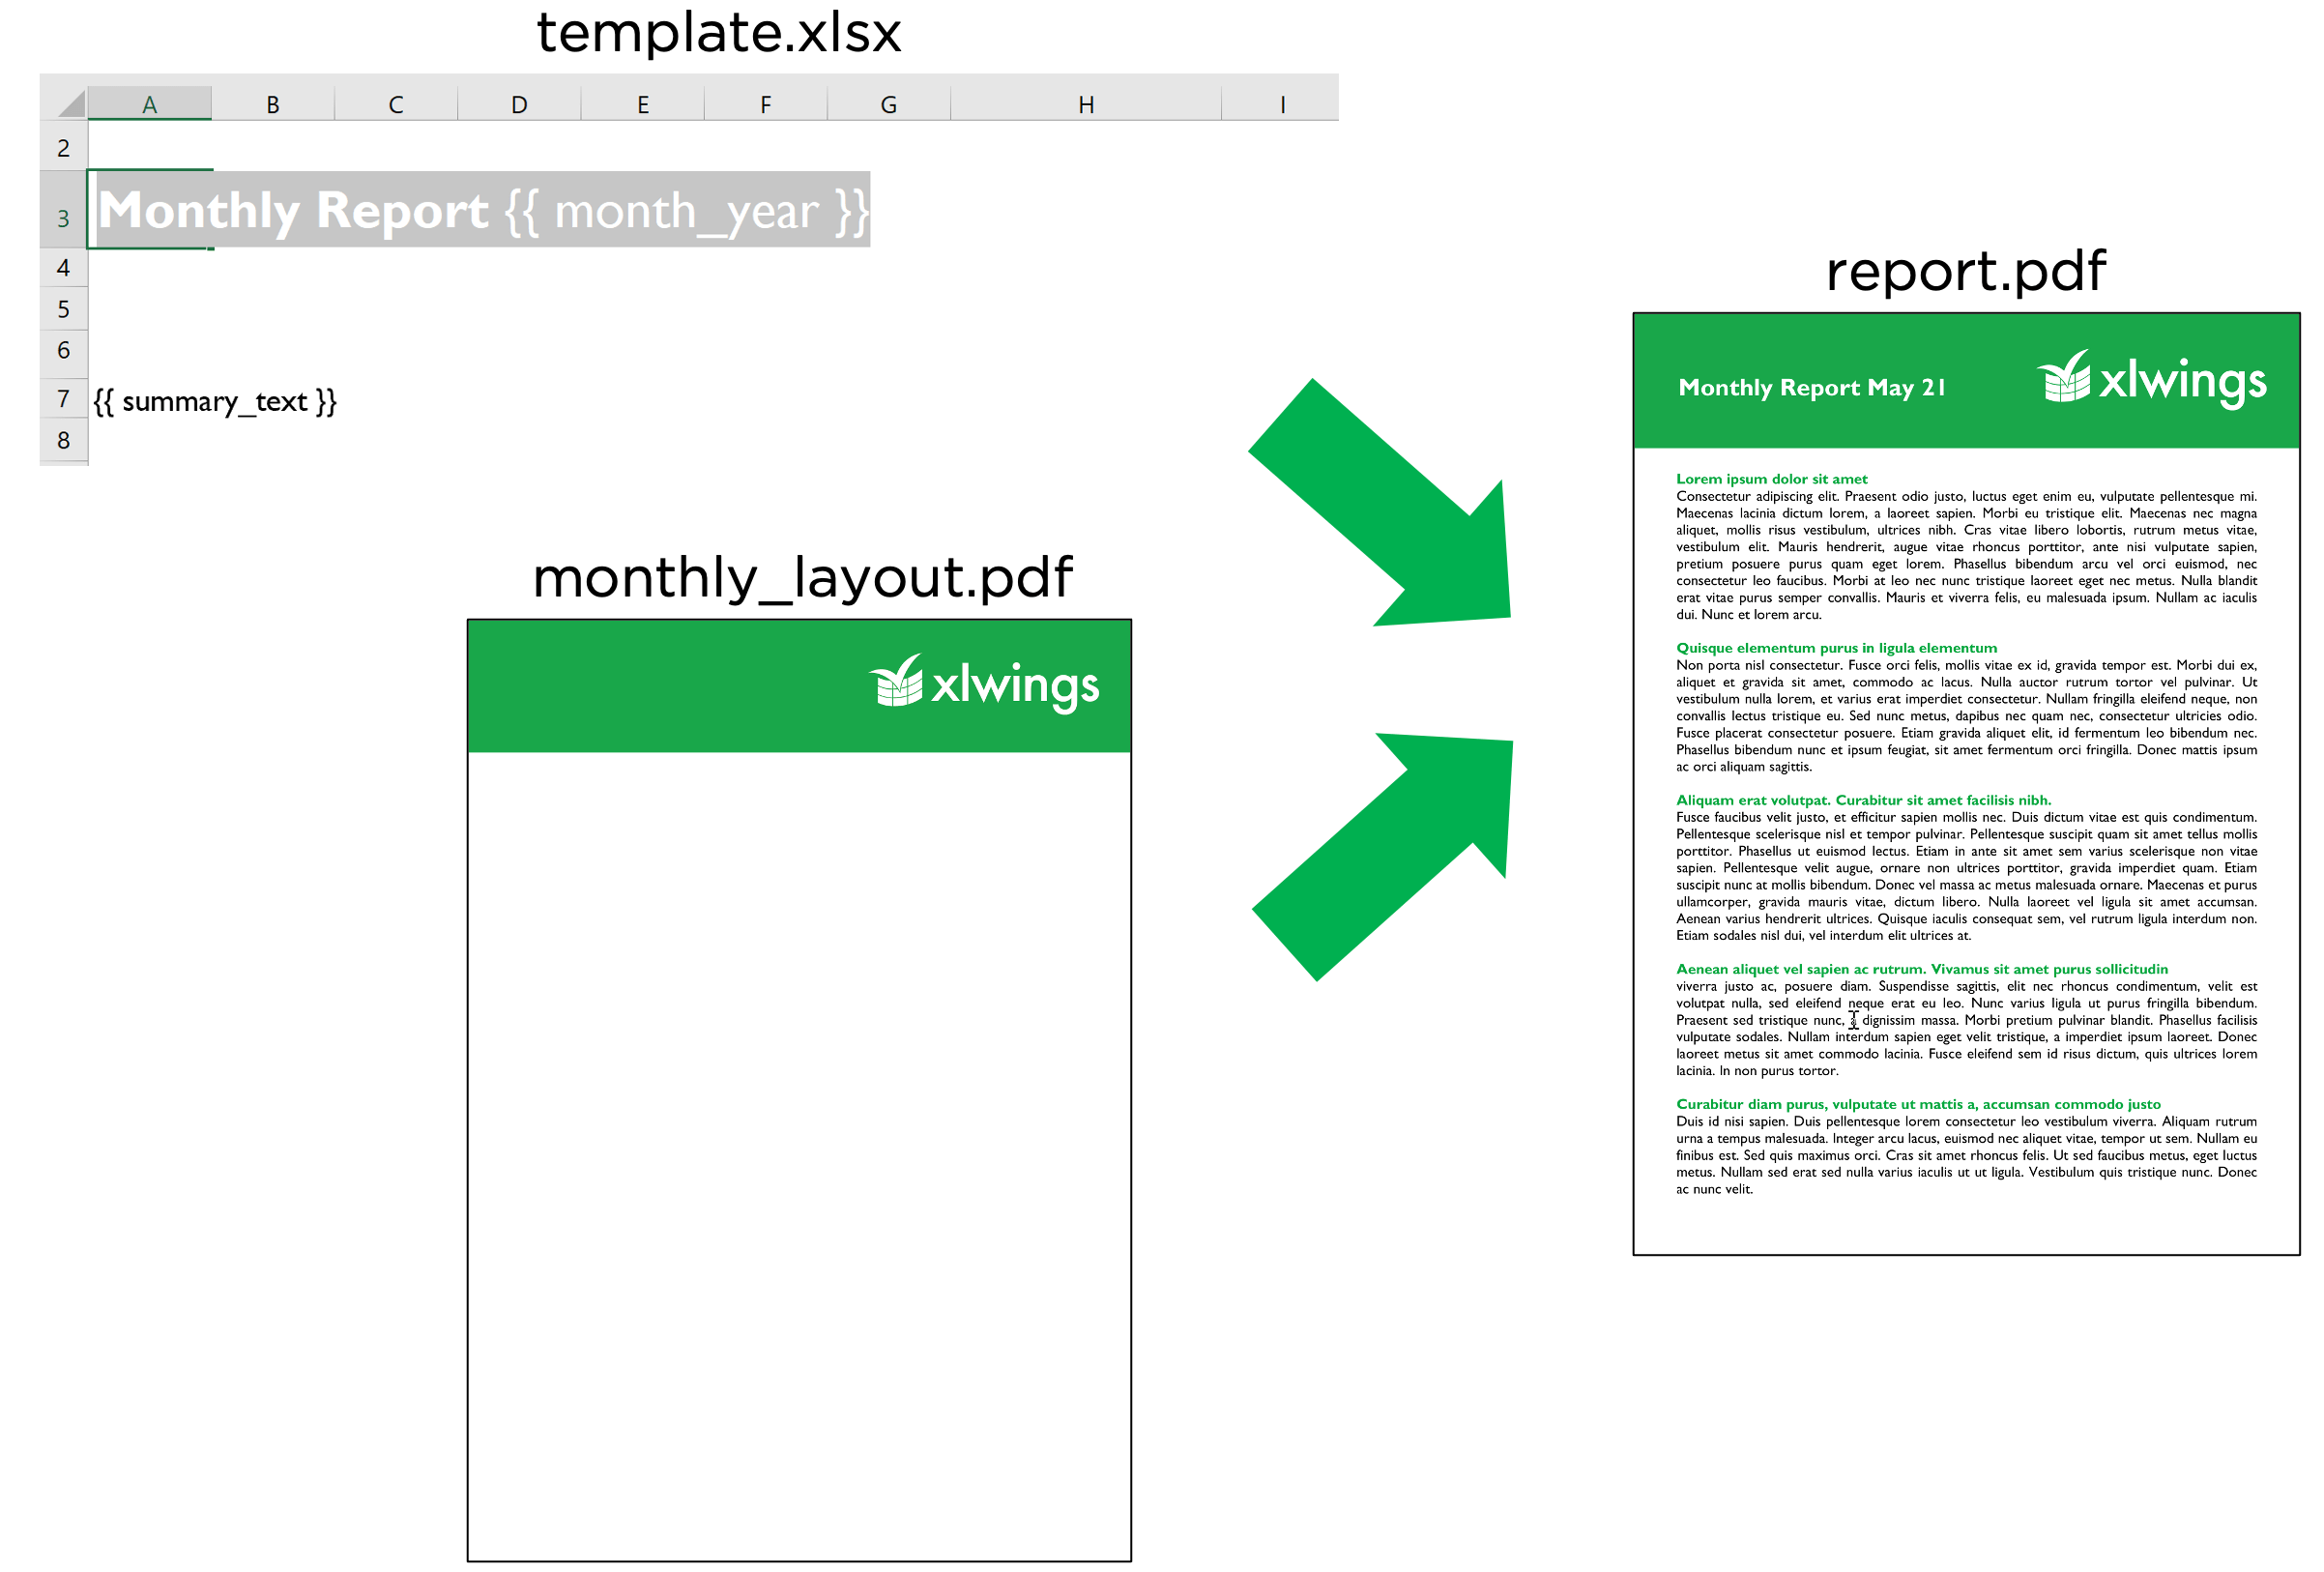
Using the layout parameter in the to_pdf() command, you can “print” your Excel workbook on professionally designed PDFs for pixel-perfect reports in your corporate layout including headers, footers, backgrounds and borderless graphics:
from xlwings.pro.reports import create_report
import pandas as pd

df = pd.DataFrame([[1, 2, 3], [4, 5, 6], [7, 8, 9]])

book = create_report('template.xlsx',
                     'report.xlsx',
                     month_year = 'May 21',
                     summary_text = '...')

book.to_pdf('report.pdf', layout='monthly_layout.pdf')