Matplotlib & Plotly Charts
Matplotlib
Using pictures.add(), it is easy to paste a Matplotlib plot as picture in Excel.
Getting started
The easiest sample boils down to:
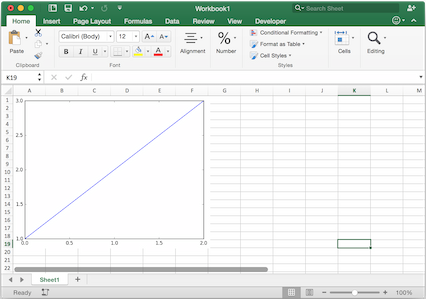
import matplotlib.pyplot as plt
import xlwings as xw

fig = plt.figure()
plt.plot([1, 2, 3])

sheet = xw.Book().sheets[0]
sheet.pictures.add(fig, name='MyPlot', update=True)
Note
If you set update=True, you can resize and position the plot on Excel: subsequent calls to pictures.add()
with the same name ('MyPlot') will update the picture without changing its position or size.
Full integration with Excel
Calling the above code with RunPython and binding it e.g. to a button is straightforward and works cross-platform.
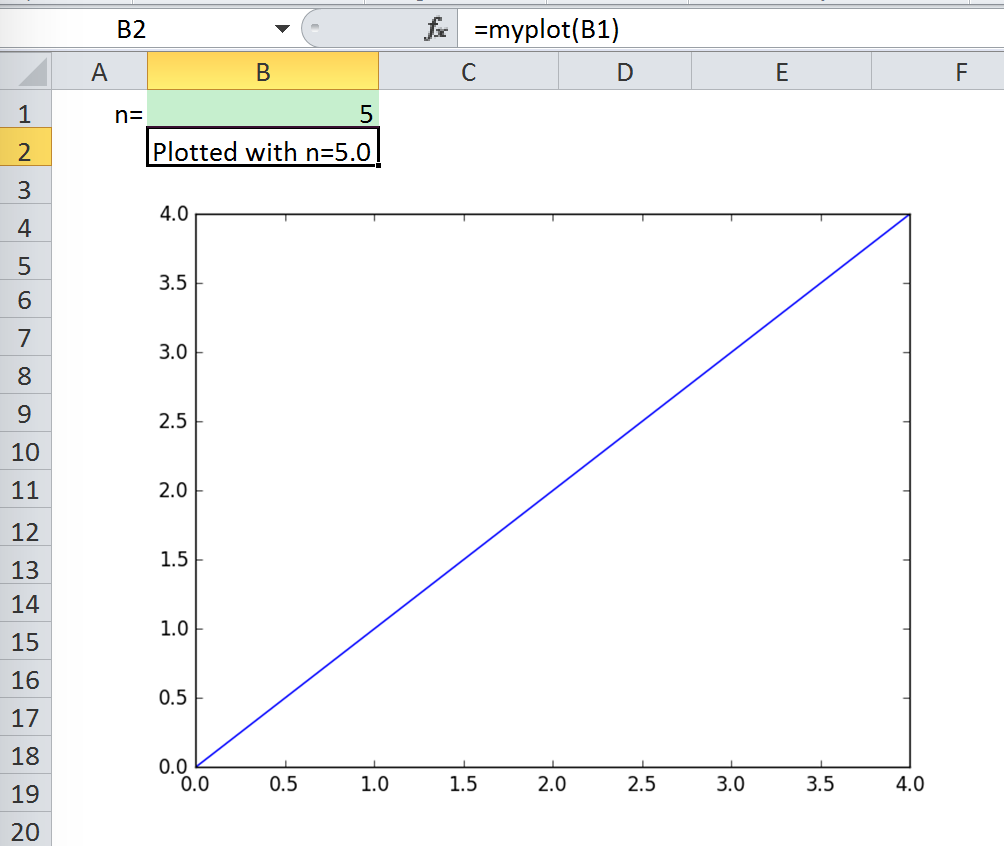
However, on Windows you can make things feel even more integrated by setting up a UDF along the following lines:
@xw.func
def myplot(n, caller):
    fig = plt.figure()
    plt.plot(range(int(n)))
    caller.sheet.pictures.add(fig, name='MyPlot', update=True)
    return 'Plotted with n={}'.format(n)
If you import this function and call it from cell B2, then the plot gets automatically updated when cell B1 changes:
Properties
Size, position and other properties can either be set as arguments within pictures.add(), or
by manipulating the picture object that is returned, see xlwings.Picture().
For example:
>>> sht = xw.Book().sheets[0]
>>> sht.pictures.add(fig, name='MyPlot', update=True,
                     left=sht.range('B5').left, top=sht.range('B5').top)
or:
>>> plot = sht.pictures.add(fig, name='MyPlot', update=True)
>>> plot.height /= 2
>>> plot.width /= 2
Getting a Matplotlib figure
Here are a few examples of how you get a matplotlib figure object:
via PyPlot interface:
import matplotlib.pyplot as plt
fig = plt.figure()
plt.plot([1, 2, 3, 4, 5])
or:
import matplotlib.pyplot as plt
plt.plot([1, 2, 3, 4, 5])
fig = plt.gcf()
via object oriented interface:
from matplotlib.figure import Figure
fig = Figure(figsize=(8, 6))
ax = fig.add_subplot(111)
ax.plot([1, 2, 3, 4, 5])
via Pandas:
import pandas as pd
import numpy as np

df = pd.DataFrame(np.random.rand(10, 4), columns=['a', 'b', 'c', 'd'])
ax = df.plot(kind='bar')
fig = ax.get_figure()
Plotly static charts
Prerequisites
In addition to plotly, you will need kaleido, psutil, and requests. The easiest way to get it is via pip:
$ pip install kaleido psutil requests
or conda:
$ conda install -c conda-forge python-kaleido psutil requests
How to use
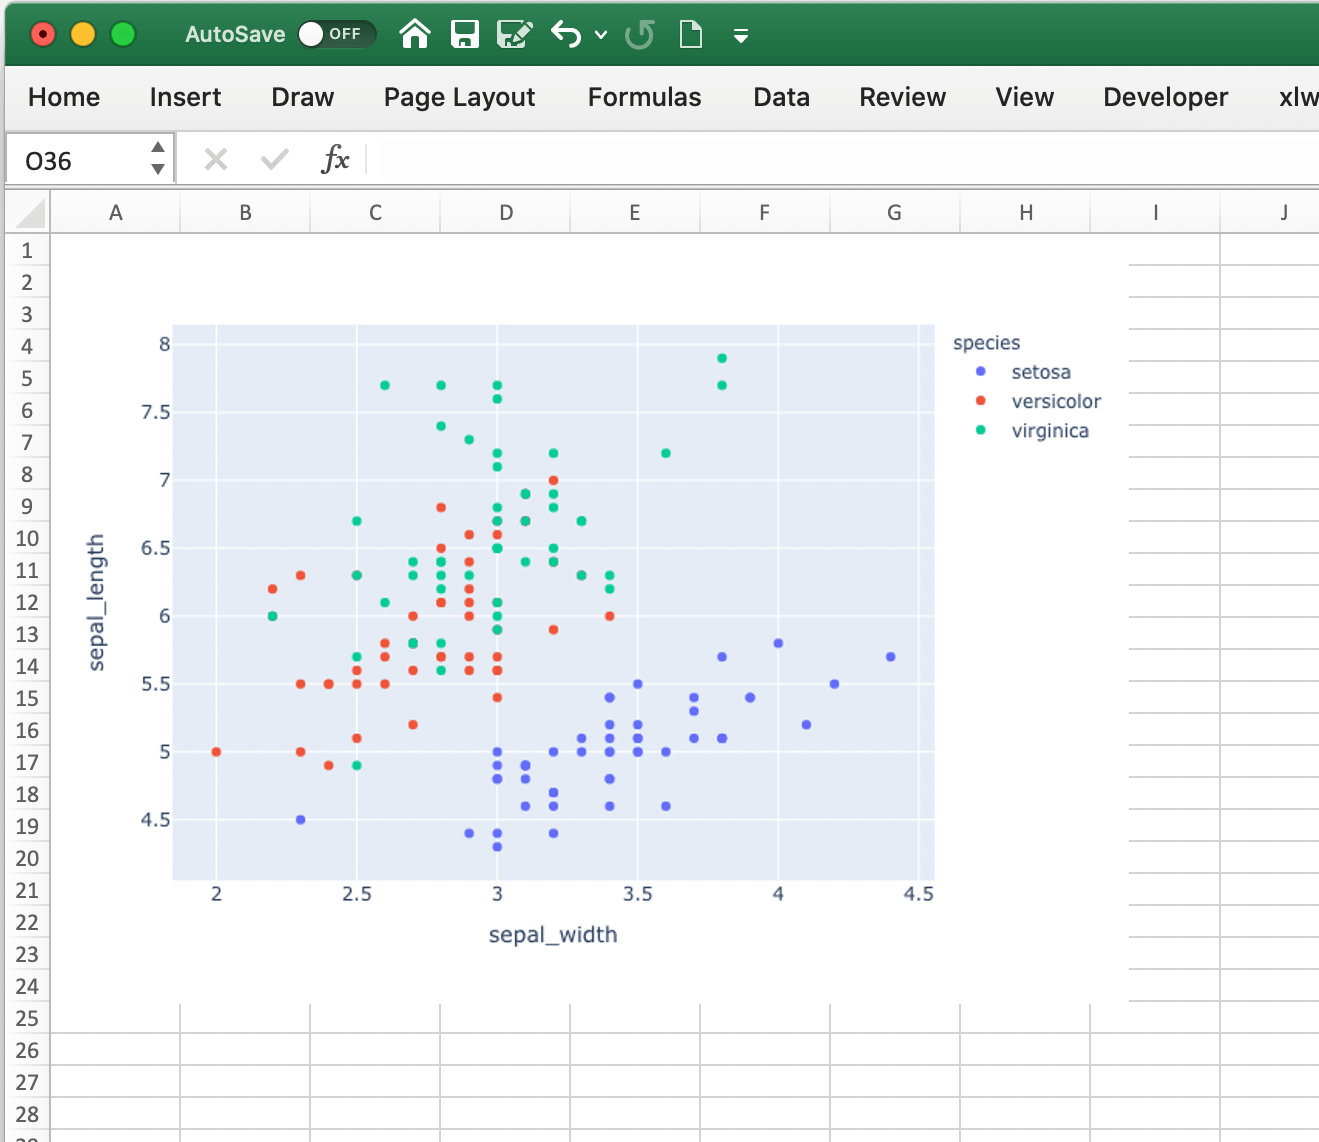
It works the same as with Matplotlib, however, rendering a Plotly chart takes slightly longer. Here is a sample:
import xlwings as xw
import plotly.express as px

# Plotly chart
df = px.data.iris()
fig = px.scatter(df, x="sepal_width", y="sepal_length", color="species")

# Add it to Excel
wb = xw.Book()
wb.sheets[0].pictures.add(fig, name='IrisScatterPlot', update=True)